1. Extensibility
According to Gartner, “The ability to govern deployments, promote user-generated content to trusted enterprise sources, deal with complex large datasets, extend and embed analytic content and support large global deployments have taken on new importance.”
2. Ease of Use
“The business intelligence and analytics platform market’s shift from IT-led reporting to modern business-led analytics is now mainstream. Modern BI tools that can support greater accessibility, agility and analytical insight while also maintaining ease of use (but at enterprise scale and trust for complex and large datasets) will drive and dominate new buying.”
3. Affordability
Leaders in the market demonstrate an “understandable and attractive pricing model that supports proof of value, incremental purchases and enterprise scale.”
4. Security
“Capabilities that enable platform security, administering users, auditing platform access and utilization, optimizing performance and ensuring high availability and disaster recovery.”
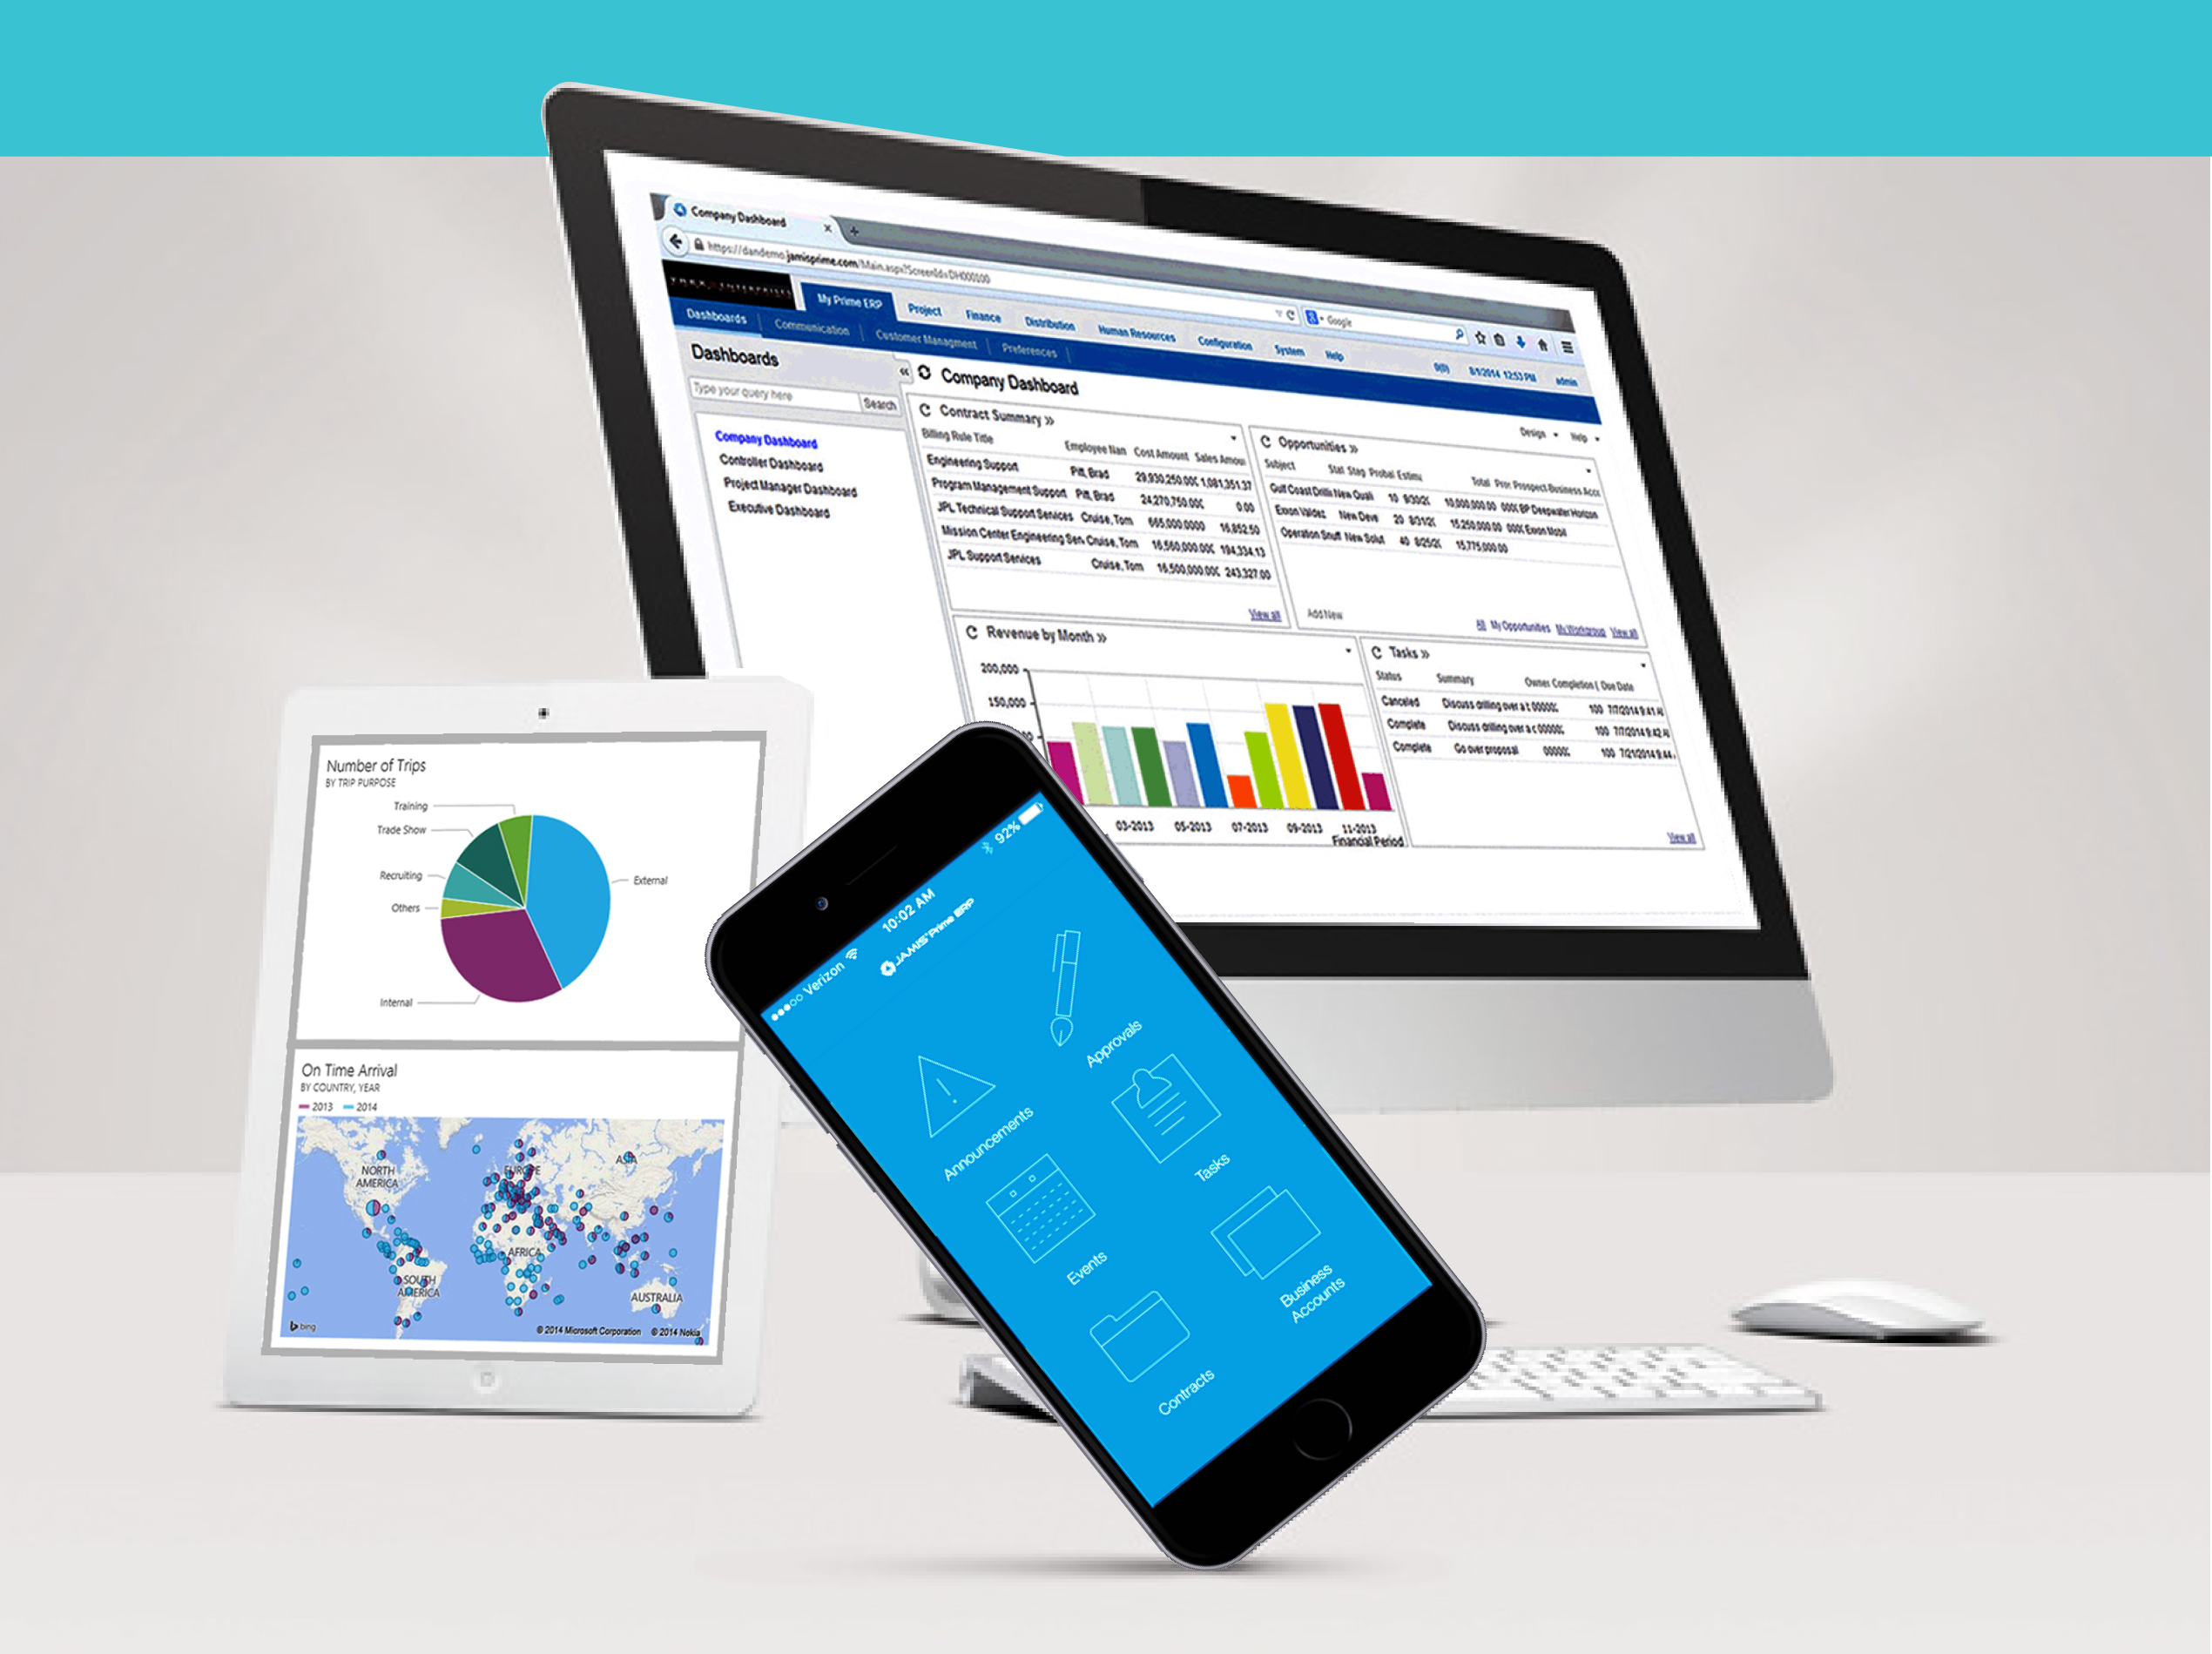
5. Dashboards & Visualization
“Enables the exploration of data via an array of visualization options that go beyond those of basic pie, bar and line charts to include heat and tree maps, geographic maps, scatter plots and other special-purpose visuals. These tools enable users to analyze and manipulate the data by interacting directly with a visual representation of it to display as percentages, bins and groups.”
To find out more about how JAMIS Prime can help you deliver results and enable powerful dashboards and analytics through its native application and integration with Microsoft Power BI, sign up for our on-demand webinar HERE. Or sign up for a personal demo of the application today –> HERE.
